1. Quick guide
Please download this molecule file to follow the tutorial: propane.pdb
Step 1: Upload molecule file
In this step we will upload the propane molecule file you have saved on your computer.
-
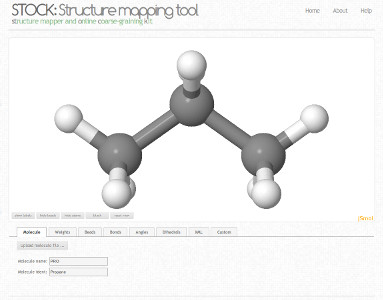
In the Molecule section click on Upload molecule file ... button and select the file propane.pdb from your computer. The molecule will appear in the visualizer.
You may scrool the mouse wheel to zoom. Click-and-drag to rotate the molecule. To reset the view, click the reset view button on the visualizer.
-
Enter PRO as the molecule name and Propane as the molecule ident.
Step 2: Create coarse-grained beads
In this step we will map atoms to coarse-grained beads.
-
Switch to the Beads section (we skip the Weights section, as the weights will be mapped automatically).
-
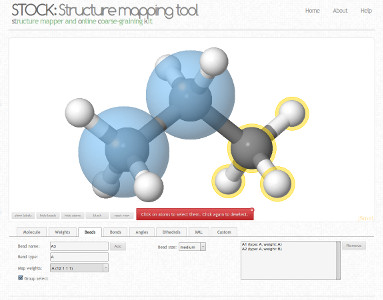
Check the Group select checkbox. This will treat a carbon and its attached hydrogen atoms as a group.
-
In the molecular visualizer, click on the first carbon atom. This will select the carbon atom and its attached hydrogen atoms.
When an atom is selected, it has a yellow halo. To deselect an atom, click it again.
-
Press the Add button. This will create a bead with the name A1 of type A and a weight mapping A.
-
Now select the second carbon atom, and click Add. And, finally, the same for the third carbon atom.
The beads and weight mappings are now defined. Let us now proceed to the next step.
Step 3: Adding bonds
In this step we will add bonds between coarse-grained beads.
-
Switch to the Bonds section.
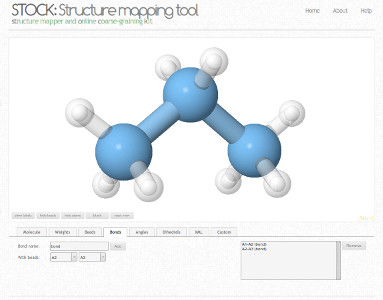
Bonds are defined by selecting a pair of beads from the drop down menus. The bond is displayed in yellow color on the visualizer.
-
Beads A1 and A2 should already be selected. Press the Add button. The added bond is displayed in blue on the visualizer.
-
Beads A2 and A3 should now already be selected. Press the Add button.
The two bonds are now defined. Let us now proceed to the next step.
Step 4: Adding an angle
In this step we will add an angle between the three coarse-grained beads.
-
Switch to the Angles section.
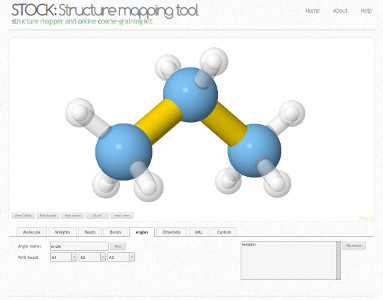
Like bonds, angles are defined by selecting a triplet of beads from the drop down menus. The angle is displayed in yellow color on the visualizer.
-
Beads A1, A2 and A3 should already be selected. Press the Add button. The added angle is displayed in blue on the visualizer.
The angle is now defined. Let us now proceed to the final step.
Step 5: The generated XML file
In this step, the XML file is generated.
-
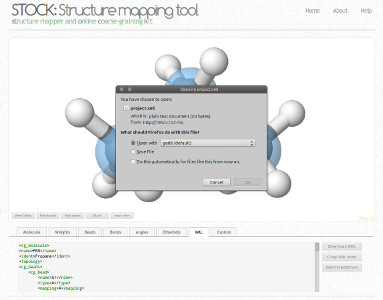
Switch to the XML section.
The contents of the generated XML file are displayed.
-
Press the Download XML button. You will be prompted to save the generated file. The file may be used in the VOTCA or DL_CGMAP package.
This is all for this quick guide! Press next, to return to first page.
Back to Table of Contents